
Euro Union GDP Falls Behind China

The EU had become the worlds largest economy in US dollars terms, with an economy even larger than that of the US in size. The withdrawal of the UK from the EU, which was a $2.7 trillion economy in 2020, prompted analysts to forecast a re ranking within a few years.
The 27-member EU recently posted a preliminary annual GDP growth of 5.2 percent on Monday, which translates into a GDP of 14.09 trillion euros, roughly $15.73 trillion in current dollars, below Chinas $18 trillion GDP recorded in 2021.
Chinas GDP has thus surpassed that of the European Union for the first time in history of say last four hundred years in 2021, earlier than previously estimated, as EU posted its whole-year GDP performance on Monday.
Analysts said overtaking EU in terms of GDP is a milestone event, meaning China has finally reached its true position as the worlds second-largest economy in every sense. Till around 1700 AD, it used to be at this position right behind the World Economic giant India. Of course that time United States of America was not even born.
In the current times, China had become the worlds second-largest economy (in US $ terms) after overtaking Japan in 2010 only. The change in GDP ranking, faster than an October report by IMF that put “surpassing date” in 2022, reflects the global pandemic effect on the European Union.
The faster-than-anticipated overtaking also underlined Chinas advancement in a wide range of sectors from new-energy vehicles and artificial intelligence to cloud computing and Internet of Things in recent years, eclipsing the EU.
The EUs GDP in the first quarter of 2021 outstripped that of China, but Chinese economy has been expanding at a faster rate after that. China of course also has advantage of having a vast captive market of 1.4 billion Chinese.
The EU and the Chinese economy have different growth rhythms due to their inherent patterns, and the EU lacking of a strong internet economy and digital economy also accelerated China’s overtaking of the bloc.
Now all this time, Since last 20 years and especially the last 10 years, another economic giant never obsessed with GPD growth rate (in US $ terms), has been shifting it’s attention to achieving higher quality growth and sustainability.
Though in per capita terms, the above economic giant still lags behind many, in GDP growth of US dollars term, it has already become the 5th largest economy. The economic giant is none other than India.
The GDP ranking battle is an ongoing one as different economies with marked difference in traits gear up to vie for performance in a seemingly foreseeable post-virus world.
The GDP in US dollar terms is a very false indicator of economic performance of any country. The true picture is given when the GDP is calculated in terms of PPP that he Purchasing Power Parity of each country’s currency.
PPP has often been used to gauge global poverty thresholds only and Also used by the UN in constructing the Human Development Index.
These surveys such as the International Comparison Program include both tradable and non-tradable goods in an attempt to estimate a representative basket of all goods.
The data for GDP at purchasing power parity has also been rebased using the new International Comparison Program price surveys and extrapolated to 2007.
GDP (PPP) means the Gross Domestic Product based on purchasing power parity.. This article includes a list of countries by their estimated GDP (PPP).
Countries are sorted by GDP (PPP) estimates from financial and statistical institutions that calculate using market or government official exchange rates.
The data given on this page are based on the International Dollar, a standardized unit used by economists. Certain regions that are not widely considered countries such as the EU also show up in the list if they are distinct jurisdiction areas or economic entities.
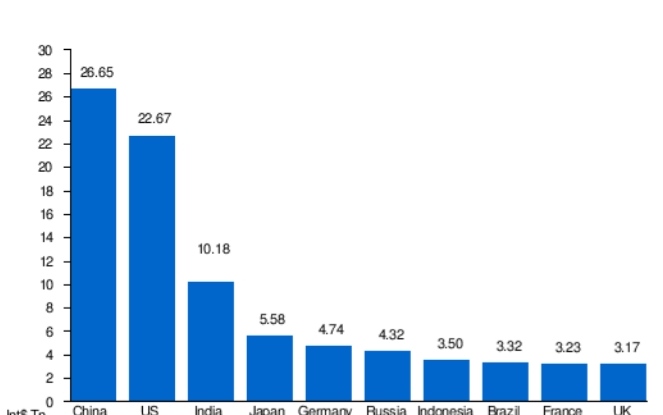
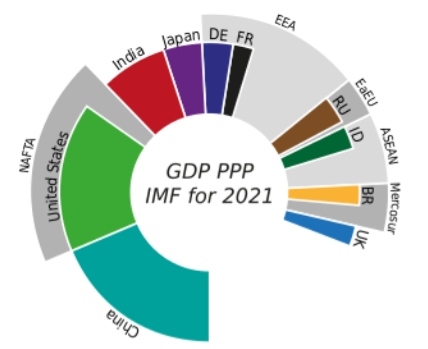
Selection of GDP PPP data (top 10 countries and blocks) in no particular order
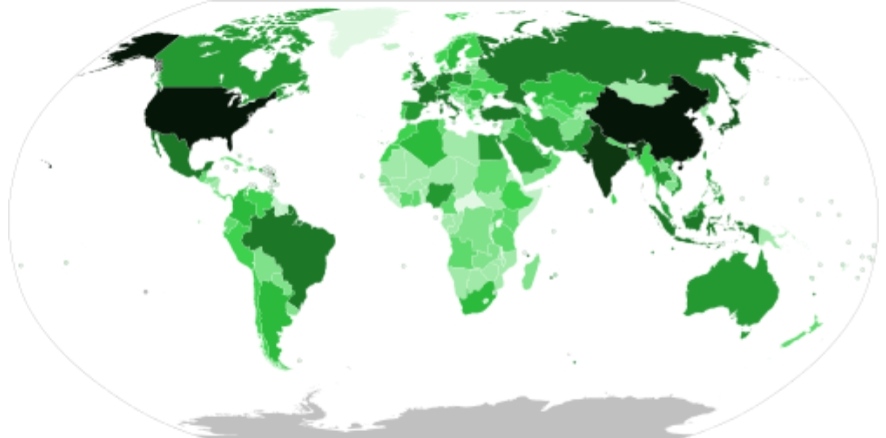
Countries by GDP (PPP) in 2020.
| > $20 trillion $10–$20 trillion $5–$10 trillion $2–$5 trillion | $1–$2 trillion $500 billion – $1 trillion $250–$500 billion $100–$250 billion | $50–$100 billion $25–$50 billion $5–$25 billion < $5 billion |
GDP comparisons using PPP are arguably more useful than those using nominal GDP when assessing a nation’s domestic market because PPP takes into account the relative cost of local goods, services and inflation rates of the country, rather than using international market exchange rates, which may distort the real differences in per capita income.
So from the above it clearly emerges that India is already the Worlds third largest economy in the true sense if the word. Very soon, say in the next 8 to 10 years, it should be catching up, if not overtaking the USA. Thereafter in the next decade, India should reach its true place on the table, as the number one. It had always retained that position till the loot started by the East India Company.

